Social Media Marketing Statistics That Tell You Where to Focus in 2026
 Stacey Corrin
Stacey Corrin
Stacey Corrin
 John Turner
John Turner
John Turner

TL;DR Here are the social media marketing statistics that actually matter for your strategy in 2026.
- 5.41 billion active social media users: That is roughly 66% of the global population, making social the largest addressable marketing channel on earth.
- TikTok leads on engagement: Users average 95 minutes per day on the app, more than any other platform, making it the highest-reach option for discovery and contest visibility.
- $255 billion in ad spend: Global social media advertising is projected to hit that figure in 2026, about 30% of all digital ad spend.
- 71% of e-commerce sales happen on mobile: If your landing pages are not built for mobile, you are losing the majority of social-driven traffic before it converts.
- Influencer marketing returns $5.78 per dollar spent: That outperforms most traditional ad channels and explains why influencer budgets keep growing year over year.
You are trying to figure out where to put your energy this year. You have budget, you have platforms to choose from, and you need to justify the decision to someone. That is the situation most marketers are in right now, and it is exactly what these social media marketing statistics are here to answer.
I have been working in digital marketing long enough to watch entire platforms rise, stall, and reinvent themselves. The data below highlights what is growing, where attention is shifting, and which social networks still drive real business impact.
- Global Social Media Usage Statistics
- Social Search and Discovery Statistics
- Most Popular Social Media Platforms
- Mobile Social Media Statistics
- Social Media Marketing Statistics: Advertising and Ad Spend
- Social Media ROI Statistics
- Influencer Marketing Statistics
- Social Media Content and Engagement Statistics
- Social Engagement and Customer Experience Stats
- Social Media Selling Statistics
- Frequently Asked Questions
Global Social Media Usage Statistics
Social media now reaches the majority of the world’s population, making it one of the largest marketing channels ever created.
As of early 2026, over 5.72 billion people are online. That is roughly 70% of the global population.
Social media usage continues to grow alongside internet access. There are 5.41 billion active social media identities globally, with nearly 180 million new users added in the past year alone.
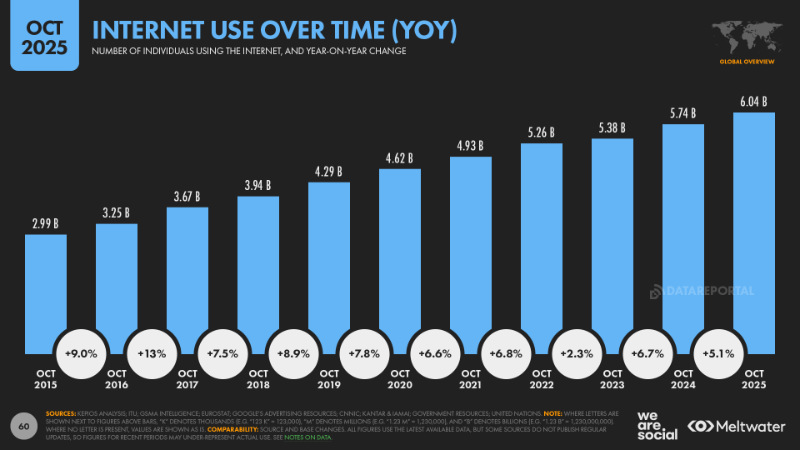
On average, people spend 2 hours and 24 minutes per day on social media. That accounts for about 15% of their waking hours, making social platforms one of the most consistent places to earn attention.
Source: Digital 2026 Global Overview [DataReportal]
Social Search and Discovery Statistics
One of the biggest shifts in 2026 is where people start their search. They are increasingly skipping Google and going straight to social platforms.
41% of Gen Z users search social platforms before they search Google. For product discovery specifically, social platforms now account for more than 60% of first-touch research among users under 35.

When comparing trust signals, Gen Z trusts social platform search results more than AI chatbot responses for product recommendations. This matters for how you structure your content and where you put your visibility budget.
For contest and giveaway discovery, this shift is significant. A giveaway that shows up in TikTok or Instagram search has a shorter path to a new audience than one that relies entirely on organic Google traffic.
Source: Sprout Social Insights
Free: Download Our Giveaway Playbook
Templates, prize ideas, and promotion strategies in one guide.
Most Popular Social Media Platforms
Facebook still leads by sheer user count, but platform size alone does not tell the full marketing story in 2026. The right platform for your business depends on your audience demographics and what you are trying them to do.
The table below shows estimated monthly active users for the world’s largest social networks. Use this as a reach benchmark, not a guarantee of engagement or conversions.
| Platform | Monthly Active Users (2026) |
|---|---|
| 3.15 billion | |
| 3.10 billion | |
| YouTube | 2.75 billion |
| 2.45 billion | |
| TikTok | 1.92 billion |
| X (Twitter) | 590 million |
Source: Statista – Global Social Networks Ranked
Facebook Statistics
Facebook remains the largest social media platform in the world and continues to influence purchase decisions, especially for local and service-based businesses.
The platform now has 3.15 billion monthly active users. India is the largest market with more than 450 million users, followed by the United States and Indonesia.
In the U.S., users aged 25 to 34 are still the most active. At the same time, usage among people aged 55 and older has grown, driven by community groups, Events, and Facebook Marketplace.
Facebook also plays a key role in buyer research. More than 53% of users say they use the platform to look up brands before making a purchase.
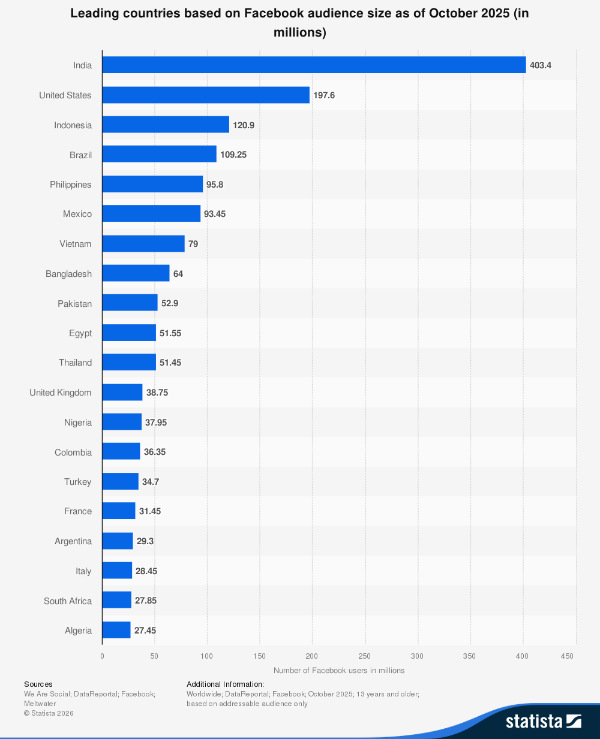
Source: Statista – Facebook Users by Country
YouTube Statistics
YouTube is both a social platform and the world’s second-largest search engine, which makes it uniquely powerful for long-term visibility.
In 2026, YouTube has reached 2.85 billion monthly active users. India remains the largest market with nearly 500 million users, while the United States user base has grown to around 253 million.
The platform skews toward a broad 18-to-49 age range, with the 25-to-34 segment the most active. Gender is roughly balanced globally, though YouTube reaches more than 95% of the U.S. male internet audience aged 18-to-49.
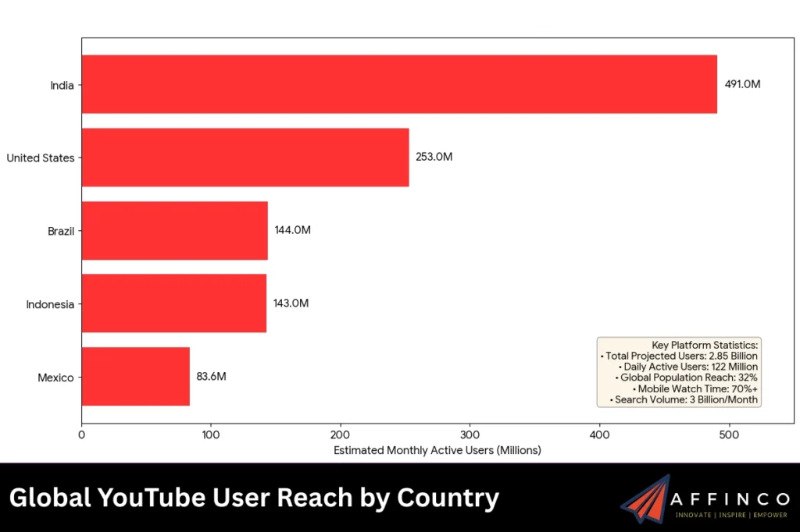
Virality on YouTube continues to set industry benchmarks. The GTA VI trailer became the most-watched video game reveal in 24 hours, surpassing 90 million views.
Short-form video is driving the platform’s next growth phase. YouTube Shorts now averages more than 200 billion daily views, proving that discovery and engagement are not limited to long-form content.
Source: YouTube Statistics 2026 [Affinco]
WhatsApp Statistics
WhatsApp has become a direct sales and support channel, not just a messaging app.
The platform now has more than 3.1 billion users worldwide. Businesses increasingly rely on WhatsApp for product questions, order updates, and one-to-one sales conversations.
This shift is already paying off for Meta. Click-to-WhatsApp ads have reached a $10 billion annual revenue run rate, showing how comfortable users are with starting purchases inside a chat.
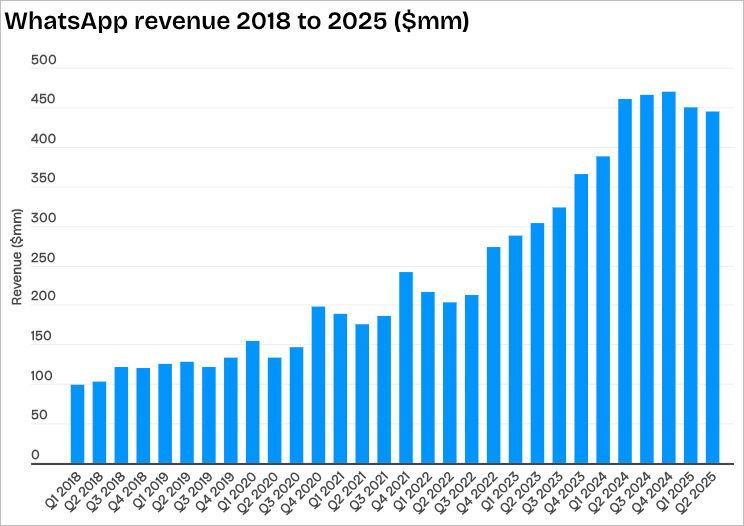
Source: Business of Apps – WhatsApp Revenue and Usage
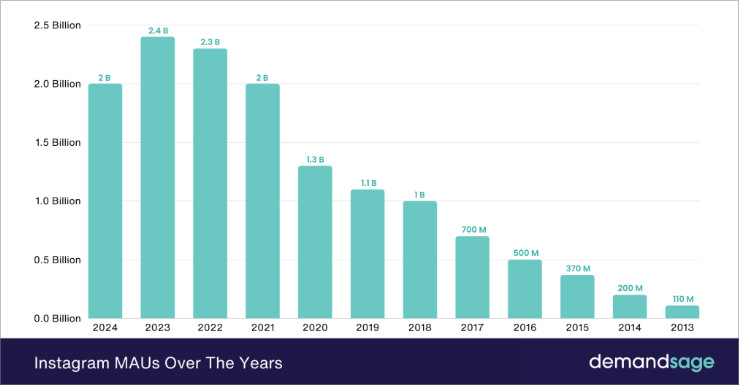
Instagram Statistics
Instagram is now a short-form video and discovery platform first, with Reels driving most new engagement.
The platform has reached 2.45 billion monthly active users, fueled largely by global Reels adoption.
User demographics have also shifted. The global audience is now nearly evenly split, with 51% male and 49% female users.
Instagram remains especially important for younger audiences. More than 70% of U.S. teenagers use the app at least once a week, making it a key channel for Gen Z brand awareness.
Source: DemandSage – Instagram Statistics 2026
TikTok Statistics
TikTok delivers the highest engagement of any major social platform in 2026.
The platform now has 1.92 billion users worldwide. While it originally skewed female, the audience is now more balanced, with 52% female and 48% male users.
What sets TikTok apart is time spent. Users average 95 minutes per day on the app, more than any other social network. This makes TikTok especially effective for discovery, repeat exposure, and trend-driven content.

Source: Statista – TikTok Demographics
That 95-minutes-per-day figure matters for giveaway strategy. When users are spending that much time in one app, a contest entry on TikTok gets more repeat impressions than almost any other platform. One of the simplest ways to turn that attention into action is to run a social media giveaway that rewards people for engaging with your brand.
X (Twitter) Statistics
X remains a relevant platform for real-time conversations, breaking news, and brand-to-audience engagement, despite its smaller scale compared to other networks.
Monthly active users now stand at 590 million globally. The platform’s user base skews toward educated, higher-income adults, with the 25-to-34 demographic most represented.

Brand content on X sees an average engagement rate of around 0.05%, which is lower than Instagram or TikTok. But for real-time events, product launches, and conversations with an engaged niche audience, it still outperforms broader reach channels on relevance and immediacy.
Source: Statista – Global Social Networks Ranked
Mobile Social Media Statistics
Mobile is the primary way people access social media in 2026.
Nearly 95.8% of social media users access platforms through a mobile device. On platforms like Facebook and TikTok, mobile usage exceeds 98%.

This behavior carries directly into buying habits. Mobile commerce now accounts for 71% of all e-commerce sales. If your site or landing pages are not built for mobile first, you are likely losing the majority of social-driven traffic.
Source: Statista – Mobile Commerce Market Share
Social Media Marketing Statistics: Advertising and Ad Spend
Social media advertising continues to grow because it matches how people discover, research, and buy products. 90% of small businesses now use social media as part of their marketing mix, according to industry research, which reflects how accessible the channel has become regardless of budget size.
In 2026, global social media ad spending is projected to reach $255 billion, accounting for roughly 30% of all digital ad spend. Video remains the strongest format, with 92% of businesses reporting higher ROI from video-based campaigns, according to Wyzowl’s Video Marketing Report.
The fastest growth area is social commerce. Buying directly inside social apps is now standard behavior, not an experiment. The global social commerce market is valued at approximately $2.6 trillion and is expected to reach $8.5 trillion by 2030.

Source: SellersCommerce – Social Commerce Statistics and Statista – Social Commerce Market Size
Not every campaign needs ads. Simple social media giveaway ideas can still drive strong engagement when they are aligned with how people use each platform.
Social Media ROI Statistics
ROI is the question every marketer eventually has to answer. Here is what the data shows about where social media actually delivers returns.
When marketers measure social media success, engagement rate is the top metric (cited by 40% of teams), followed by conversion rate and revenue. Follower count has dropped significantly as a primary KPI, which reflects a more mature approach to measurement.
On ROI by platform, Facebook and Instagram consistently deliver the strongest B2C returns, particularly for e-commerce and consumer goods. LinkedIn leads for B2B, where it drives higher-value conversions even at lower volume.
Video content is where the ROI gap widens most. Marketers who invest in short-form video report 25-30% higher return on social ad spend compared to static image campaigns.
The measurement challenge is real: 55% of marketers say proving social media ROI is their biggest frustration. Attribution is messy because social often influences a purchase decision several steps before the final click.

Running a contest marketing campaign gives you a cleaner measurement window than most social activities. Entry counts, email captures, and follower growth are directly attributable to the campaign, which makes ROI calculation more straightforward.
Source: HubSpot – State of Marketing 2026
Influencer Marketing Statistics
Influencer marketing has moved from a nice-to-have to a standard line item in most digital marketing budgets. The numbers explain why.
The global influencer marketing industry is expected to reach $33 billion in 2026. Average return on investment across influencer campaigns is around $5.78 per dollar spent, which outperforms most traditional display and social ad formats.
Trust is the core mechanic. 61% of consumers trust influencer recommendations more than brand-published content. For Gen Z specifically, influencer content is the primary way they discover new products, ahead of search, TV, and brand social accounts.

Micro-influencers (10,000 to 100,000 followers) tend to outperform larger accounts on engagement rate, with some studies showing 3-5x higher engagement than mega-influencer accounts in the same niche. Audience match matters more than raw reach.
I use RafflePress on influencer collaboration campaigns specifically because it handles the entry verification that word-of-mouth alone cannot. When an influencer drives traffic to a giveaway, you can see exactly how many people entered via their referral link. A dedicated influencer giveaway gives both parties a clean, measurable result.
Source: Influencer Marketing Hub – Benchmark Report 2026
Social Media Content and Engagement Statistics
Knowing where to post is only half the equation. The format you choose and how often you show up determine whether you earn attention or get scrolled past.
Short-form video is the highest-performing content type across platforms. Brands that invest in Reels, TikTok, and YouTube Shorts report 40% more impressions per post compared to static images, with lower production cost per view than long-form video.

Posting frequency matters, but consistency beats volume. Brands that post 3-5 times per week see stronger engagement growth than those posting daily but inconsistently. The algorithm rewards regularity more than quantity.
Human-generated content still outperforms polished brand content. 79% of people say user-generated content significantly impacts their purchase decisions, compared to branded content. This is one reason giveaways work so well as a content strategy: they generate UGC at scale.
Content format performance by platform breaks down roughly as follows: short-form video on TikTok and Instagram, long-form tutorials on YouTube, professional text and articles on LinkedIn, and real-time conversation and links on X.
A social media photo contest is one of the fastest ways to generate UGC that performs better than brand-created content would on its own.
Source: HubSpot – State of Marketing 2026
Social Engagement and Customer Experience Stats
Social media is now a frontline customer service channel.
More than 51% of Gen Z and Millennial users expect a response to a social media message within 30 minutes. Slow replies signal poor service before a purchase ever happens, and for you, that means losing buyers before they have committed.

Brands that meet these expectations see measurable gains. Strong social support is linked to a 20% to 40% increase in customer lifetime value, driven by trust, repeat purchases, and positive word of mouth.
One distinction worth noting: social media response expectations are different from email. With email, a 24-hour reply is still considered acceptable by most audiences. On social, that same delay reads as indifference. Your response speed needs to match the medium’s norms, not your internal SLA.
Source: HubSpot – State of Marketing 2026
If you want to increase social media engagement, you need more than posts. You need clear reasons for people to comment, share, or click.
Social Media Selling Statistics
Social media now plays a direct role in B2B purchasing decisions.
In 2026, 84% of C-suite executives use social media to research products and vendors before buying. Platforms like LinkedIn influence early-stage decisions long before a sales call happens.

If your team actively uses social channels, you are 51% more likely to hit quota than those who do not. That gap is not from cold outreach tactics but from showing up consistently where buyers are already researching.
Source: LinkedIn – Social Selling Index
Frequently Asked Questions
What is the success rate of social media marketing?
There is no single success rate because outcomes depend heavily on the goal, platform, and execution. That said, the data points toward consistent results: businesses that post regularly and engage with their audience see measurable lifts in brand awareness, lead generation, and sales.
For specific benchmarks: email capture campaigns through social giveaways typically convert at 30-50% of entrants into subscribers when the prize matches the audience. Ad campaigns on Facebook and Instagram average a 9-10% click-through rate to product pages when the creative is well-matched to the audience.
Which social media platform has the highest engagement rate in 2026?
TikTok has the highest engagement of any major platform, with users averaging 95 minutes per day on the app. Engagement rate on TikTok for branded content typically runs between 5-9%, compared to 1-3% on Instagram and under 1% on Facebook and X.
Instagram Reels comes second for short-form video engagement. If you are choosing one platform to invest in for pure reach and engagement, TikTok and Instagram are the clear front-runners for most consumer brands in 2026.
How much do businesses spend on social media advertising?
Globally, businesses are projected to spend $255 billion on social media advertising in 2026, representing about 30% of total digital ad spend. At the individual business level, most small-to-mid-size businesses allocate between 10-25% of their total marketing budget to social media.
Budget efficiency varies significantly by platform. Facebook and Instagram tend to offer the lowest cost-per-click for e-commerce. LinkedIn has higher CPCs but stronger conversion rates for B2B leads, which often justifies the spend.
How does social media marketing impact sales?
Social media influences sales at multiple stages of the buyer journey, not just at the top of the funnel. 84% of C-suite executives use social platforms to research vendors. 53% of Facebook users look up brands before purchasing. Social commerce is now a $2.6 trillion global market.
The most direct path from social to sales is social commerce: in-app purchasing on Instagram, TikTok Shop, and Facebook Marketplace. Giveaways are effective at an earlier stage, converting social attention into email subscribers who you can then market to directly.
Is social media marketing effective for small businesses?
Yes, with a targeted approach. 90% of small businesses use social media as part of their marketing mix, and the channel has a cost advantage over traditional advertising that makes it particularly well-suited to limited budgets.
The key for small businesses is focus. Trying to maintain an active presence on every platform spreads effort too thin. Picking one or two platforms where your audience is most active and engaging consistently there outperforms a diluted presence everywhere. Giveaways are especially efficient for small businesses because they generate email list growth and social follows in a single campaign, without requiring a large ad budget.
Final Thoughts
The data above tells you where people spend their time. The next question is what to do with that attention.
Running a giveaway on the platforms with the highest daily engagement is one of the fastest ways to convert that time into something you own: email subscribers, social followers, and customer data that does not disappear when an algorithm changes.
RafflePress lets you run giveaways directly from WordPress, with 30+ entry actions covering every major platform in this article. TikTok follows, Instagram tags, YouTube views, and email signups all feed into a single campaign. Over 200,000 sites use it to turn social traffic into list growth without relying on paid ads alone.
You may also find the following guides helpful:
If you liked this article, please subscribe to our YouTube Channel for RafflePress video tutorials. You can also find us on Twitter and Facebook.


